
| > Special Upgraded CPT Dashboard Offer Below < Refer a friend, if they sign up you get a free month | ||||
| My Youtube Channel | Facebook Group | My CC Podcasts | FREE Spreadsheets | CPTDashboard.com |
| Click here | Click here | Click here | Click here | Click here |

| The always free CPT 'Covered Call' Newsletter - just trying to UP your Game! Share! via your social/email | ||||
| Welcome to this month's CPT Newsletter! | ||||
| WELCOME BACK EVERYONE! to the CPT Newsletter on Writing Covered Calls and Selling Cash Secured Puts. In this Newsletter I will share with you my experiences, trades and other good stuff that should 'Up Your Game!' | ||||
| Since last Newsletter so many things have been happening ... the markets are rallying to ALL TIME HIGHS STILL, the China Trade Wars are basically OFF which keeps giving us great opportunities to Buy Low, Sell High ... Iran caused some stuff which caused the markets to sell off a bit but as that situation cooled, Wall Street got back into stocks with both feet ... Tech stocks are DOMINATING the buying but as they mentions on CNBC all the time these days ... something like 9 stocks ... YES, 9 stocks (Apple types) are moving the markets ... so when you have low volume and the markets depending on these 9ish stocks powering the moves ... should Wall Street bag profits, ie sell sell sell, it will be VIOLENT ... I would expect a -1,000 down day ... BUT, were not there yet and remember, the numbers are SO BIG now, -1,000 down days only represent a small percentage of the overall DOW Jones 30 ... CNBC will be screaming SELL SELL SELL ... but its all relative ... make good decisions. Now, with earnings coming look for the markets to change from NEWS driven trading to EARNINGS driven trading ... we will see. :/ | ||||
| Feel free to share this link with anyone or on social > | ||||
| Let's break down the Newsletter because it looks like a TON of blah blah | ||||
1) SHOW ME THE MONEY! No other guru's I give you an up to date yearly trading totals!
| ||||
2) CHART OF THE MONTH! See the World Thru My Eyes - Phillips 66 (PSX)
| ||||
3) COVERED CALL 'TIP of the MONTH' - Position Sizing
| ||||
4) The SPECIAL OFFER is Back - The Upgraded CPT Dashboard FREE MONTH!
| ||||
4) Exclusive Newsletter podcast - DEEPER Dive in Position Sizing
| ||||
5) ALL Social ALL the TIME! Youtube / Facebook - join our 'like minded community today!'
| ||||
| "SHOW ME THE MONEY!" | ||||
| As of this Newsletter post date, 2019 YEAR END TOTALS! (Goal was $50,000) | ||||
| $49,436.70 | 21.97% | |||
| 2019 was STILL an awesome year even though I did not achieve my $50,000 goal. I was able to prove that with this Selling Premium strategy I could make +20% Cash-on-Cash again (like I did last year and it feels good to know I've learned a skill that will help me have success in the stock market ... whether it goes Up or Down. | ||||
| NEWSLETTER STOCK CHART BREAKDOWN | ||||
| DISCLAIMER: This chart is based on this date. I'm not suggesting a move up or down. I'm showing a chart I'm watching. I'm not recommending this stock as a purchase. Think of it like this, your showing the world thru my eyes and how I see this chart. This Chart of the Week was posted for all the Upgraded CPT Dashboard subscribers last month. | ||||
| - to fully understand the chart breakdown, read the setup first, then it'll become more clear as you read it - | ||||
| THE SETUP: I love making LOW ENTRY stock purchases and have done many videos on the various sharting 'indicators' I use when charting a stock. I like stocks that trade with an RSI under 50, trades near traditional SMA 100, 200 support lines, trading under the Keltner Channel MID line and I want to see an UP trending OBV line (see definitions for all of these below) | ||||
| CHART OF THE MONTH | ||||
| Phillips 66 | PSX |  | LAST TRADE > | $104.87 |
| POSTED ON | 1/11/2020 | |||
| See the World thru my eyes' - chart breakdown of the week | ||||
| UNDERSTAND - PSX makes its most profits with LOW oil prices ... use that as a guide when doing your DD on PSX ->PSX is feeling the pain of geo-political news with the ordeal with Iran and oil spiking higher, then peeling back but what we need to observe is how PSX has been falling, ever so slightly in this HIGHER stock market since topping back in late December. Notice how back in Nov and Dec PSX just couldn't break out (go higher thru its top resistance) ... and with the RSI dipping out of a momentum range (60/70/80's) PSX is now bottom feeding on all charts indicators I watch for a LOW ENTRY purchase. PSX now looks to have LESS DOWNSIDE at this point ... if could go to its 200 SMA at $99x before Wall Street really jumps back in. Right now were getting LESS BUYING vs HEAVY SELLING in PSX and the market makers keep ticking this down to get buyers. The GOOD with PSX is that OBV line where even in this doward drift its momentum is still in an UP trend to sideways which means Wall Street is still interested. See the indicator breakdowns below for further details | ||||
| RSI | SMA (100) | SMA (200) | KELT MID | OBV TREND |
| 31.24 | 113 | 99.81 | 109.77 | HIGHER, SIDEWAYS |
 | |  | | |
| CLICK IMAGE TO SEE IT LARGER IN ITS OWN BROWSER WINDOW | ||||
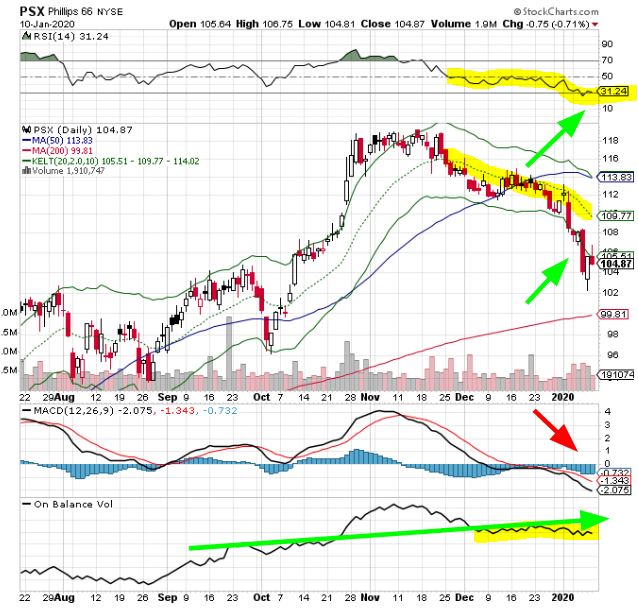
| What's the RSI telling me? | ||||
| RSI - 20/30 represents a stock that is Over Sold and we need to have caution and understand why its being Over Sold. This is where I like picking up shares for a nice 'low entry' purchase | ||||
| CPT - PSX is trading with more Bearish v Bullish now that its dipped into the 40's and 30's RSI ... it seems less downside risk vs upside gain for the patient investor | ||||
| Support Lines | ||||
| SMA - When looking for a 'Low Entry' purchase we would love to BUY near the 100 day or 200 day support line. It's not 100% but its a 'Buy Low' situation vs 'Buying High' | ||||
| CPT - With PSX slipping under the 100 day SMA its primed for some buying by value investors but with the 20 day SMA being $99 and the stock at $104 ... Wall Street might want it to test that 200 day SMA before they start seriously buying unless good news comes... it could drift a bit lower ... again, less downside risk but still has that 200 SMA test risk | ||||
| Keltner Channel Breakdown | ||||
| KC - The stock is trading UNDER the KC MID line which presents more of a 'Low Entry' purchase and now is the time for me to start watching the stock. I like buying for value UNDER the MID line. | ||||
| CPT - Notice that Wall Street DIDN'T buy up PSX once it enters the lower KC band back in late Dec2019 ... which surprised me ... then as the stock drifted lower in a stock market that was rallying to new highs ... Wall Street has concerns with PSX or the entire oil sector. I'd check charts of Chevron and other big oil players to see if its PSX or the greater oil sector ... notice the Iran conflict caused the stock price to spike above the KC MID ... that was oil related ... so I'd be doing a deep dive into what PSX is or isn't doing to cause this sell off. | ||||
| On Balance Volume or buying momentum ... is it trending Up? | ||||
| OBV - The 'On Balance Volume' trend line is UP which tells technical traders that the stock has good momentum or in straight talk, people are BUYING IT. This is a 'Green' checkmark for me. | ||||
| CPT - Good news, note the OBV momentum line is still sideways to higher ... which suggests even with this selloff Wall Street is still sticking in $$$ ... possible value investors because PSX is a top oil refiner in the sector and will be ok long term. | ||||
| Further research with - Using charts for technical analysis, Dividend information and Earnings Report Date | ||||
| RSI, SUPPORT LINES | KELTNER, OBV | |||
| View Chart-PSX | View Chart-PSX | |||
 |  | |||
| Definition of the various charting indicators I use | ||||
| RSI - The Relative Strength Index (RSI), developed by J. Welles Wilder, is a momentum oscillator that measures the speed and change of price movements. The RSI oscillates between zero and 100. Traditionally the RSI is considered overbought when above 70 and oversold when below 30. Source - https://www.investopedia.com/terms/r/rsi.asp | ||||
| SMA (100/200) - A simple moving average (SMA) is an arithmetic moving average calculated by adding recent closing prices and then dividing that by the number of time periods in the calculation average. ... Short-term averages respond quickly to changes in the price of the underlying, while long-term averages are slow to react. Source - https://www.investopedia.com/terms/s/sma.asp | ||||
| KC - The Keltner Channel is a moving average band indicator whose upper and lower bands adapt to changes in volatility by using the average true range. The Keltner Channel is used to signal possible price breakouts, show trend, and give overbought and oversold readings. Source - https://www.investopedia.com/terms/k/keltnerchannel.asp | ||||
| OBV - On-balance volume (OBV) is a technical trading momentum indicator that uses volume flow to predict changes in stock price. ... He believed that when volume increases sharply without a significant change in the stock's price, the price will eventually jump upward or fall downward. Source - https://www.investopedia.com/terms/o/onbalancevolume.asp | ||||
| Disclaimer - Yes - at the time of this posting I do have a position in this equity. By posting this I am by no means recommending this equity and am not front running for its performance. I have risked my own money and am accountable for the trade results. | ||||
| COVERED CALL TRADING 'TIP OF THE MONTH' | ||||
| DISCLAIMER - MOST EVERY wealth manager will advise being DIVERSIFIED in your portfolio. The idea is DO NOT put all your eggs into one basket ... well, when you SELL PREMIUM you need 100 shares of a stock which means IF you do not have that much, you WILL NOT be able to be diversified as the wealth managers would like ... so understand that going in. | ||||
| This month's Covered Call 'Tip and Trick' is all about Position Sizing... so many times I get questions about being diversified but with small ball accounts its hard so in this 'Tip and Trick' Im going to shed some light on my thoughts and how small account investors can still take advantage of the Selling Premium strategy. | ||||
| One of the most important Golden Rules for INVESTING is not putting all your eggs in one basket ... you've heard that I'm sure. The idea is simple, if you place all of your bets on one stock and that stock TANKS you are screwed! It happens to the best of us ... and its a major why being diversified in investing always makes the Top 5 list for good investing tips. | ||||
| DOES NOT MEAN you're out of the game ... however, it means you need to DOUBLE DOWN on your due diligence because you will NOT be adhering to this Golden Rule should you want to continue. Below I outline the risks and how I would approach my due diligence knowing I'm not going to be diversified in my investing and portfolio. | ||||
| #1 - You know you're going to need 100 shares ... so if you purchase a $50 stock and you only have $6,000 in your trading account ... this one stock will take up 83% of your portfolio ... typically Wealth Managers want clients with no larger than 5% diversification (ie, no stock, etf, cef, bond, etc) in the portfolio exceeds 5% stake of the entire amount ... so if this one stock is eating up 83% ... well, you're just not gonna be diversified. | ||||
| #2 - Choose wisely ... because were now investing so much in this one stock/etf/etc ... we need to make sure we reduce risk as much as possible. We need to really adhere to the remaining Golden Rules so were not buying with a ton of risk. We can't totally avoid risk, but we can narrow the risk as to feel good that we've done all we can do in making a good decision. | ||||
| Click this link to start our Golden Rule search ... everyone has an opinion | ||||
| #3 - If that's overwhelming and you still want more guidance on this ... to feel comfortable, use my Golden Rule list as a primer. | ||||
| We have to want to own the stock ... even if you know you're gonna play this stock for a quick buck ... you HAVE to want to own it. -- Avoid Earnings Reports at ALL cost ... volatility is the craziest in and around a companies earnings report. -- Buy good S&P500 type companies because typically those are the companies that will have 1) High Volume (+750,000 daily) - Golden Rule 2) Open Interest on our Strike prices - Golden Rule 3) Pays a dividend - Golden Rule ... because should you get stuck with a falling stock ... least they are paying you to hold it ... yes, SUCKS! but again, nothing is without risk. | ||||
| #4 - Understanding how to BUY BACK an option ... if a trade goes south on you its important but not necessary to buy back the option you sold (usually CHEAPER) so you can reboot and sell another option for a credit. Its commonly called - Using Exit Strategies and a simple Youtube search will result in some good learning videos ... know how to use exit strategies ... very important! | ||||
| #5 - You found a stock that meets YOUR Golden Rules for a Covered Call stock purchase ... now what? --> Make a LOW ENTRY PURCHASE <-- it at all possible... Buying LOW is as important in Selling Premium as any investment strategy ... using Chart indicators always help me determine if I'm buying HIGH, MEH or LOW ... buying high is NOT a deal breaker but with the Ups and Downs in the markets ... whats high today will probably be lower tomorrow ... so I have a 'basket' of stocks Im checking the charts on and when I find that stock trading where my chart indicators read 'GOOD' ... man, I'm now ready. below I will list my Top 5 Chart indicators for finding that LOW ENTRY purchase. | ||||
| Chart Indicators I use - not the 'end all, be all' but a good start -- 1) RSI below 50 2) Stock is trading at or below the Keltner Channel MID line 3) I want that OBV line to be sideways to higher 4) Stock is trading near or at the SMA 100, 200 support lines 5) MACD line is about to cross or has crossed indicating the stock is moving higher (Google how to read the MACD) | ||||
| My recent CHART OF THE MONTH is a Great example of what a nice Low Entry purchase is. | ||||

> Be sure to watch this month's video below for a deeper dive into position sizing :)
| SPECIAL OFFER - BUY 3 MONTHS - GET 1 MONTH FREE | ||||
| It's been a long time coming but I've finally put together the ULTIMATE Covered Call Dashboard Screener that will blow your mind! See everything that comes with a monthly subscription ... the UCPTD is updated weekly just like the FREE CPT Dashboard! | ||||
| This Special Offer expires JAN 31th | ||||
| Hi Everyone! | ||||
| LIMITED TIME - ALL CPT Newsletter members get a ONE FREE MONTH if you kick down for the 3 MONTH OFFER -> on an already ridiculously cheap Upgraded CPT Dashboard monthly subscription. | ||||
| Are you ready to "Up Your Game!" | ||||
| THE UPGRADED CPT DASHBOARD HAS YOU COVERED! | ||||
| The Upgraded CPT Dashboard is a great place to start your research for your next Covered Call stock purchase |  | |||
| Frustrated trying to find the most popular ETF's that make a good Covered Call ETF trades? The ETF Dashboard has you covered! |  | |||
| Want a list of all the stocks giving a dividend this week to play a 'Covered Call + Dividend Capture' strategy? The DIV Dashboard has you covered! |  | |||
| Looking for Closed End Funds for that monthly dividend income? The CEF Dashboard has you covered! |  | |||
| Your Exclusive Bonus content includes - The 'Fab 3' video stock chart breakdown (Seeing the World thru my Eyes), You see all my Real Trades and breakdown of why I made the trade, Special 'Ask John' Access where I work with you answering your questions and concerns via email and I do my Special Chart of the Week ... again, breaking down what I see so you can learn this stuff, get quickier in your stock chart reading so you can make better decisions before buying that next great Covered Call stock :) | ||||
 | ||||
| DON'T WAIT - THIS IS YOUR TIME TO GET A SPECIAL DISCOUNT THAT OTHERS WON'T GET | ||||
| Click here for your Special Offer! | ||||
CPT NEWSLETTER EXCLUSIVE VIDEO
| This month's CPT Newsletter I show you one of my favorite things to do in researching many articles, news stories and reading books and other stock market newsletters I receive. Using Text to Speech browser extensions allowing me to consume many more bits of data then I would ever be able to without it :) | ||||
| >>> | Click here to watch this month's Exclusive video | <<< | ||

| >>> | Click here to watch this month's Exclusive video | <<< | ||
| Are you all caught up on the recent videos? | ||||||||||||||
| Look, I get it … some of my video's rehash common Covered Call and Cash Secured Put topics you may already feel you master … but my weekly videos are generally short and you know I always give you something extra … whether it be a story or a CCW/CSP tip … check it out … I've done 2 this past week … are you caught up? | ||||||||||||||
 | Click here to watch my most recent video upload | |||||||||||||
 | Click here to Join our Covered Call Community | |||||||||||||
Join me on Facebook for the 'Off Youtube' discussion - our like minded community I've started with my CPTDashboard Covered Call Screener Spreadsheet that I offer up for free. Follow our page >
| ||||||||||||||

| "Why would I ever 'give away' my trade secrets if you're making that much money?" | ||||
| So, the first thing you need to understand with this journey I started 3 years ago is that … I am paying forward a wonderful deed my mentor and best friend Jerry did for me. You can (and I encourage) hear our story on my web site cptdashboard.com click the video 'Meet Jerry' … seeing that I was frustrated and having no success swing trading, day trading he taught me how to sell premium (Write Covered Calls) … he worked with me for over 1 year, mentoring me, answering my questions … I was apprehensive in making a mistake … screwing up … he walked me thru my first trade and that began my new life of success investing and working the stock market. You really need to hear our story if you're sceptical of what I'm doing … only then you will understand our story is genuine … I have no agenda. I show you my trades, we talk about them in hopes you learn something. It really is that genuine and simple. | ||||
| LINKS TIP for this newsletter … | ||||
| Ok, I'm NOT a webpage guru so you have to work with me … Here's what happens if you just 'click on a link' … you're taken to that website (ie, Youtube) and you'll have to click the 'BACK' button to get back … frustrating … how about this … HOVER over the link and RIGHT CLICK … open new Tab or Window … then THIS window stays open as well as the new link opens :) | ||||
| See you NEXT month and I hope you enjoyed my CPT Newsletter! | ||||
| "Hey look until next time, I hope all YOUR Covered Calls be profitable" | ||||
| Image credits - stockcharts.com | barchart.com | foolcdn.com | yahoo.com | earningswhispers.com | and me :) | ||||
| © 2020 Core Position Trading, LLC and the CPT Dashboard - All Rights Reserved | Disclaimer | |||
| This email was sent to everyone who signed up for the FREE CPT Newsletter. If you no longer want investing ideas like this, you can unsubscribe | ||||
| If you want to subscribe to our emails or get a friend on this list, forward them the email and have them click here | ||||
| Read the fine print I think you understand by now that I'm not an investment adviser and can not give any specific investment advice. For those that are interested, I tell you my story and show you my trade in the "Hopes" that by seeing me you can take away a bit of information that will "up your game" … below is the CPT Newsletter disclaimer and link to my full disclaimer. | ||||
No comments:
Post a Comment